Sensitivity of He Flames in X-ray Bursts to Nuclear Physics
Introduction
Millisecond burst oscillation phenomenon is often observed during the rise time of the X-ray burst light curve, where the oscillation frequency matches with the X-ray emission pulsation of the neutron star within few Hz. The modulation of asymmetrical burning on the surface of the neutron star due to the spreading of the initial local hotspot is the current contender theory that explains this behavior. Many have attempted to model the laterally flame propagation on the neutron star surface, with successes at studying the flame front and calculating the flame speed. In this project, I conducted a sensitivity test on how choices of nuclear reaction network, plasma screening routines, and integration coupling methods can influence the He flame dynamics. Details of the work is published in ApJ . Here I’ll just summarize the most important finding on the effect of nuclear reaction network on flame dynamics and nucleosynthesis.
Initial Model
We used Castro , a compressible hydrodynamics simulation code freely available on GitHub, to perform all the simulations. Nuclear reaction burning related modules are provided via Microphysics . To set the stage, we assumed a typical 1.4 Mo neutron star with radius of 11 km. We used a relative a relatively higher Ω = 1000 Hz to have a greater flame confinement due to Coriolis force so that a smaller simulation domain. A parallel-plane geometry with 2D axisymmetric R-Z cylindrical coordinate system is used. We considered a simulation domain of r = 1.843 × 105 cm and z = 3.072 × 104 cm, taking place on the surface of the rotating pole, where Coriolis force is the maximum. A coarse grid of 1152 × 192 zones were used, corresponding to 160 cm resolution. With 2 extra AMR levels, there are 9216 × 1536 zones for the finest grid, corresponding to a 20 cm resolution. A constant gravity is z is used since the mass of the accretion layer is negligible compared to the mass the neutron star. This corresponds to ∼ 10ˆ away from the pole at the maximum extent, allowing us to work with a constant Coriolis force in the co-rotating frame of the neutron star. Initially, the fuel layer is assumed to have pure He4 uniformly distributed horizontally in an isentropic atmosphere for z > 2000 cm. An isothermal base layer comprised of pure Ni56 for z < 2000 cm to represent the transition to the interior of the neutron star. Since the model is initially in hydrostatic equilibrium, we placed a temperature perturbation profile of 1.2 × 10⁹ K at the base of the He4 layer for r < 4.096 × 104 cm to facilitate nuclear burning, compared to T = 2 × 10⁸ K at the base of the He4 layer for r > 4.096 × 104 cm. Figure 1 shows the initial temperature profile on the left side of the domain. The total simulation time is 120 ms to prevent flame propagating outside the domain.
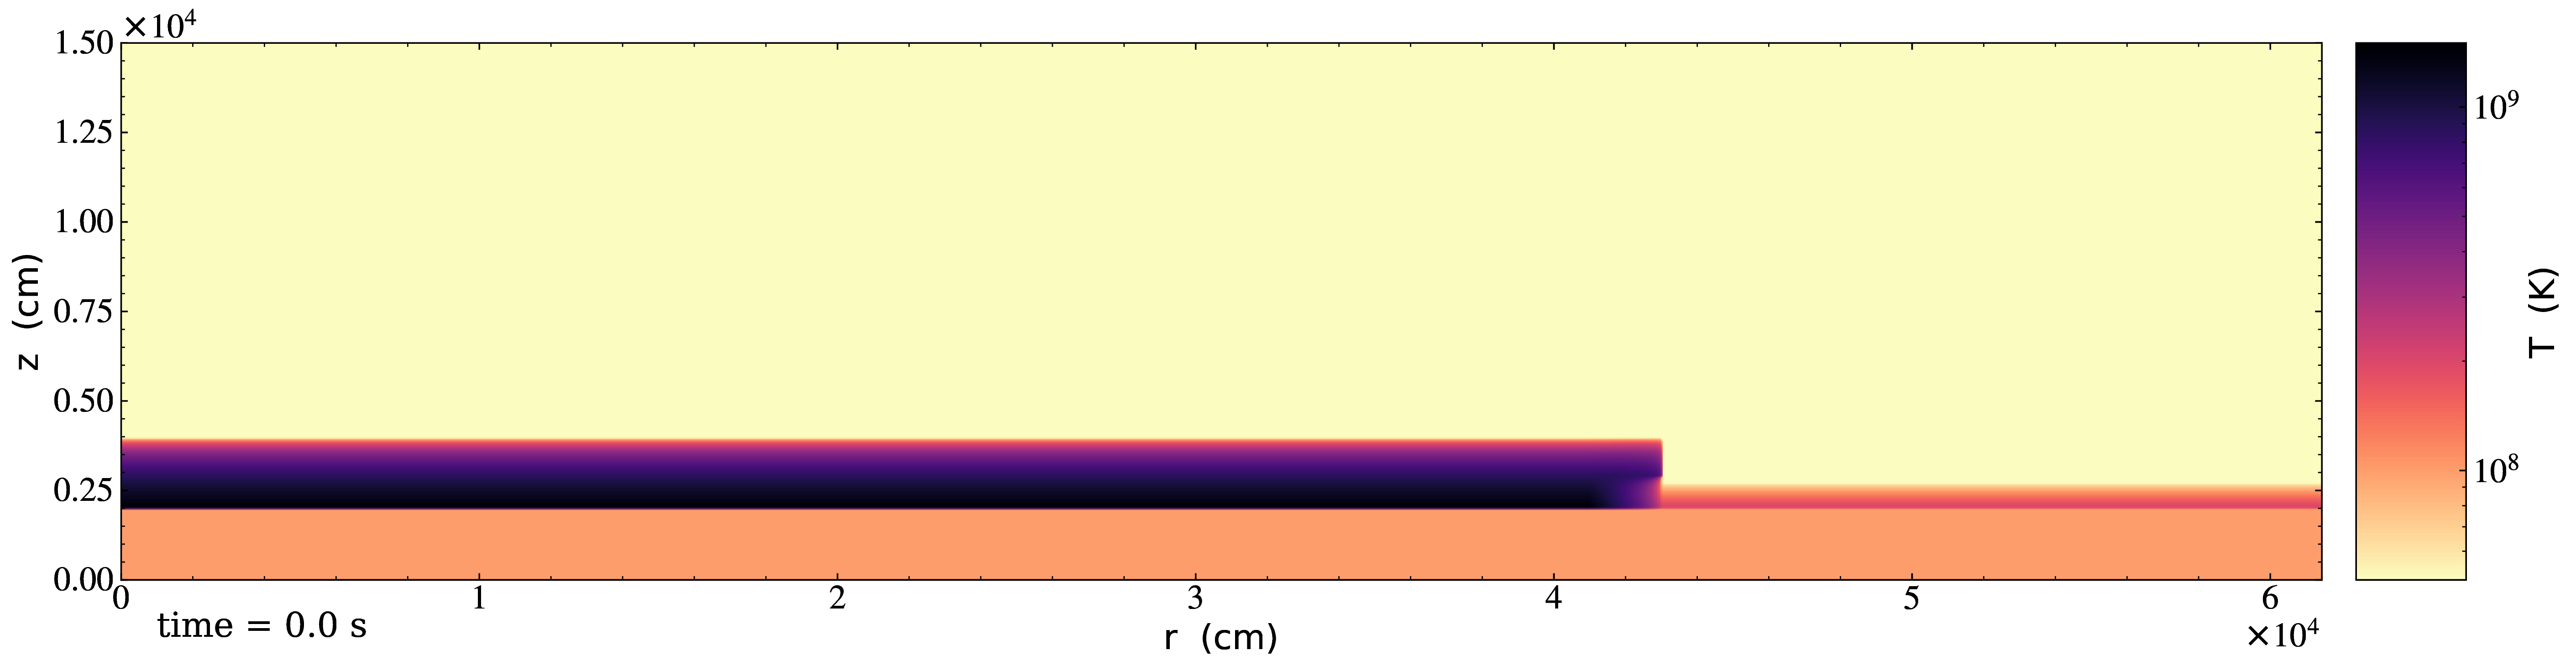
Figure 1: Slice plot showing the initial temperature pertubation. Note this only shows a small fraction of the domain.
Reaction Network
Several reaction networks were used to test the sensitivity of nuclear physics to flame dynamics. Here we only discuss the one that is found to be most relevant, subch_simple, a network comprised of 22 isotopes and 57 rates. See Figure 2 for visualizations.
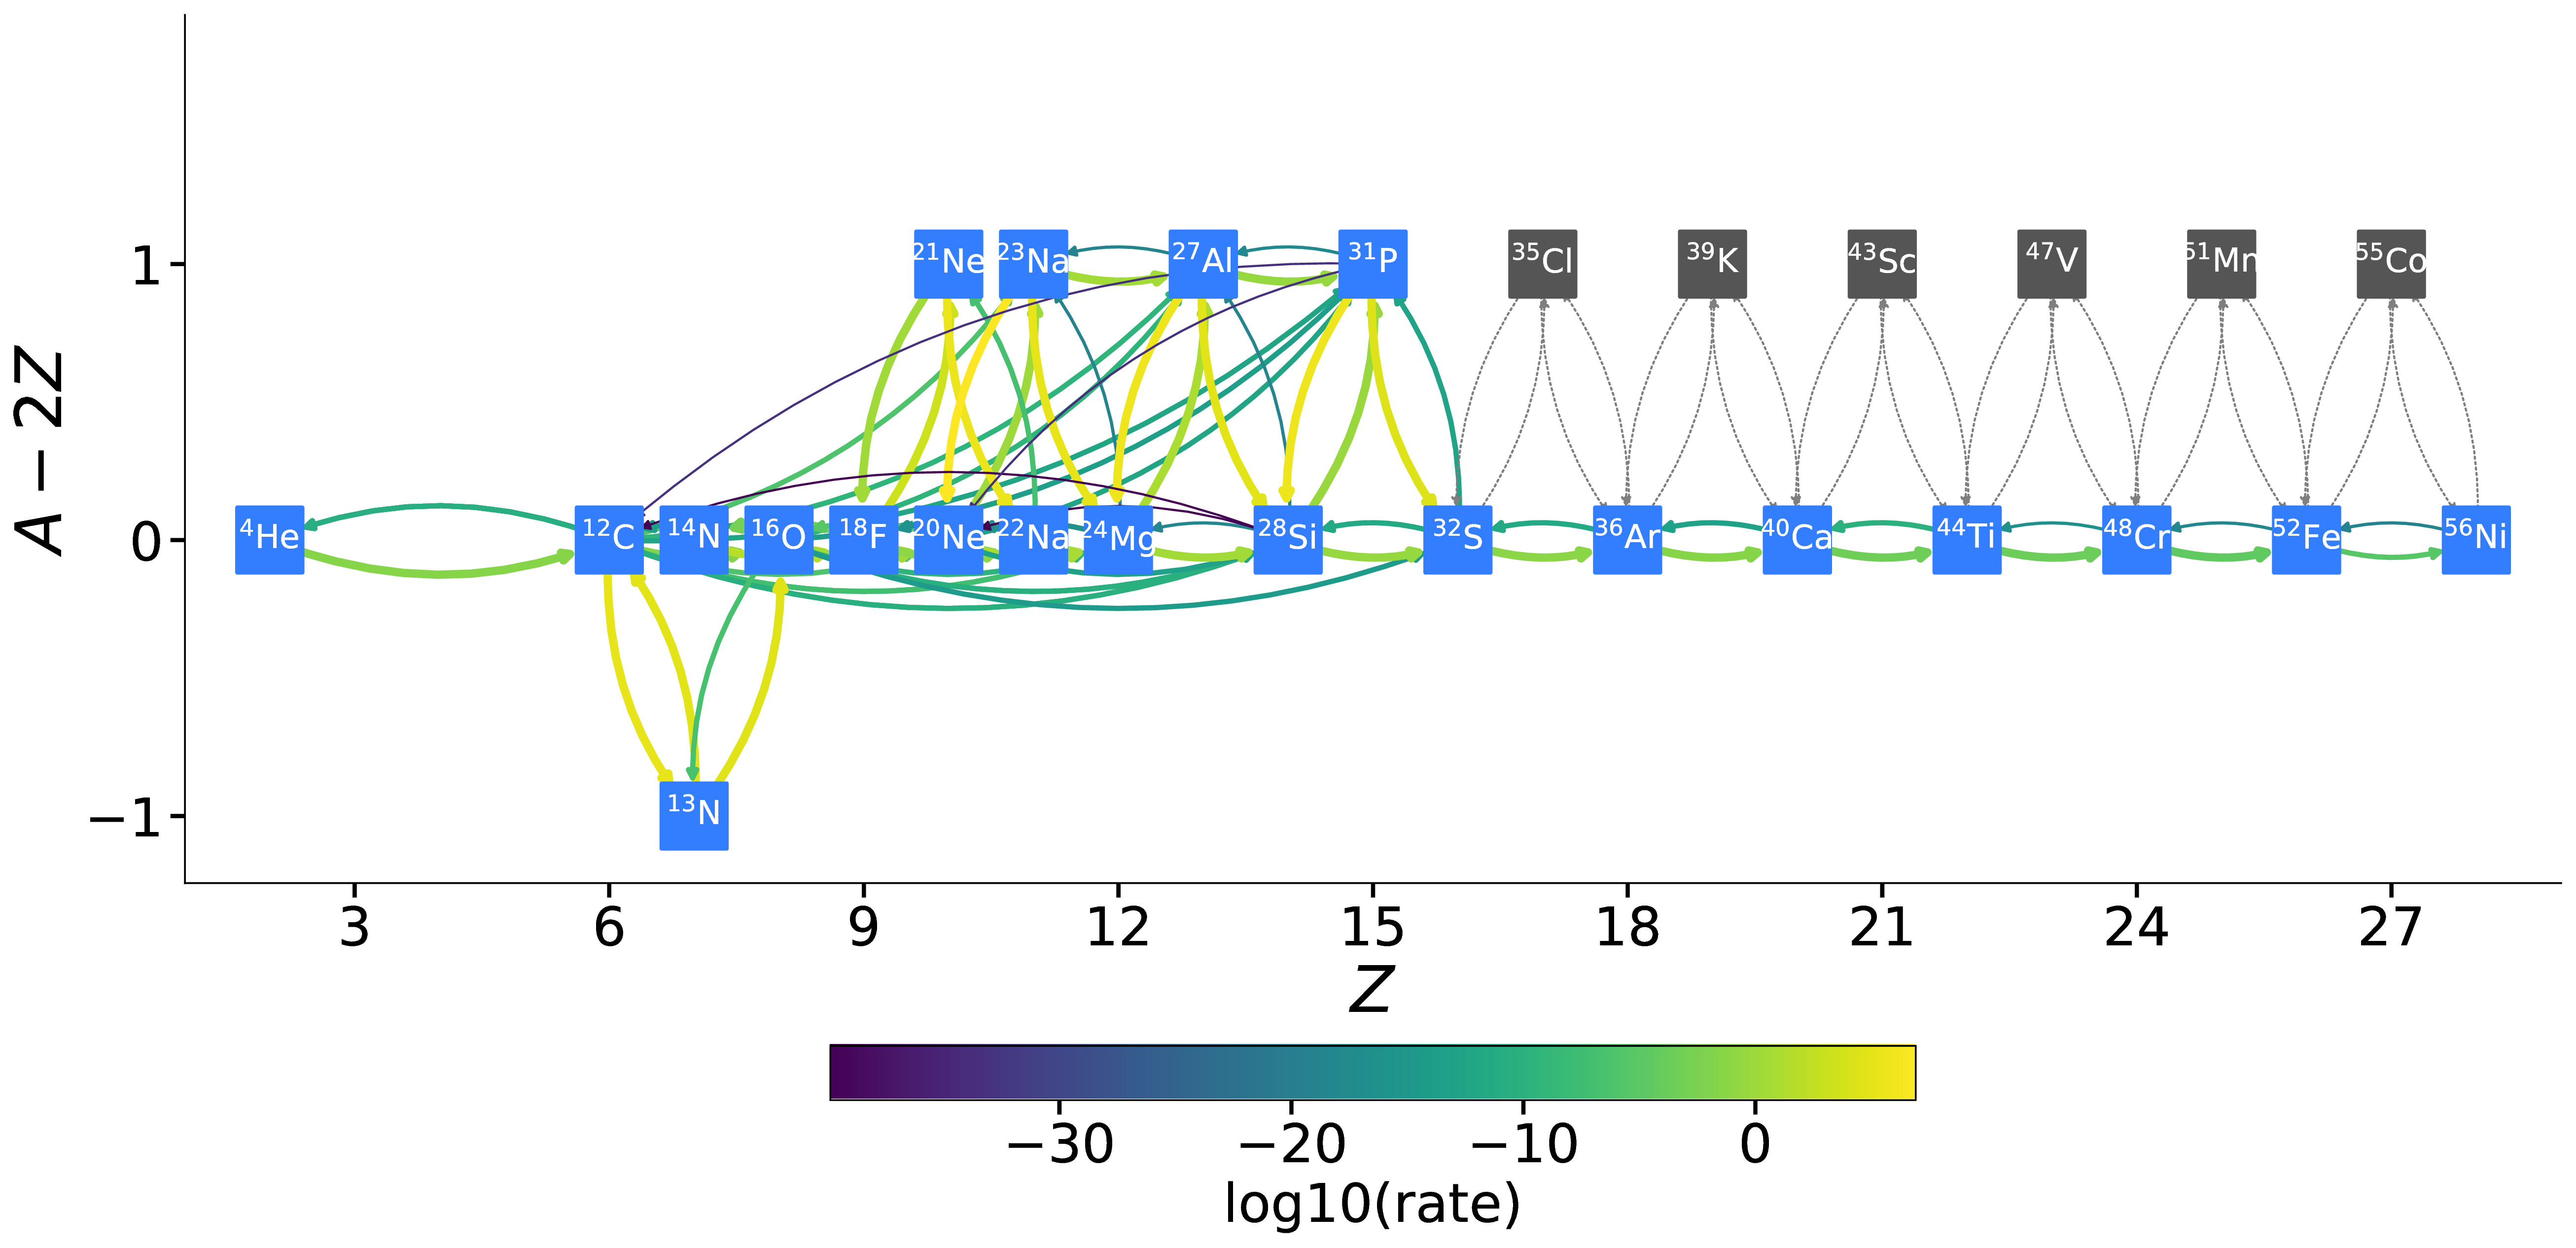
Figure 2: A visualization that shows the subch_simple network.
The classic 13-isotope α-chain network from \({}^{4}\mbox{He}\) to \({}^{56}\mbox{Ni}\) , aprox13, is used as a reference network for comparison. See Figure 3 for visualizations.
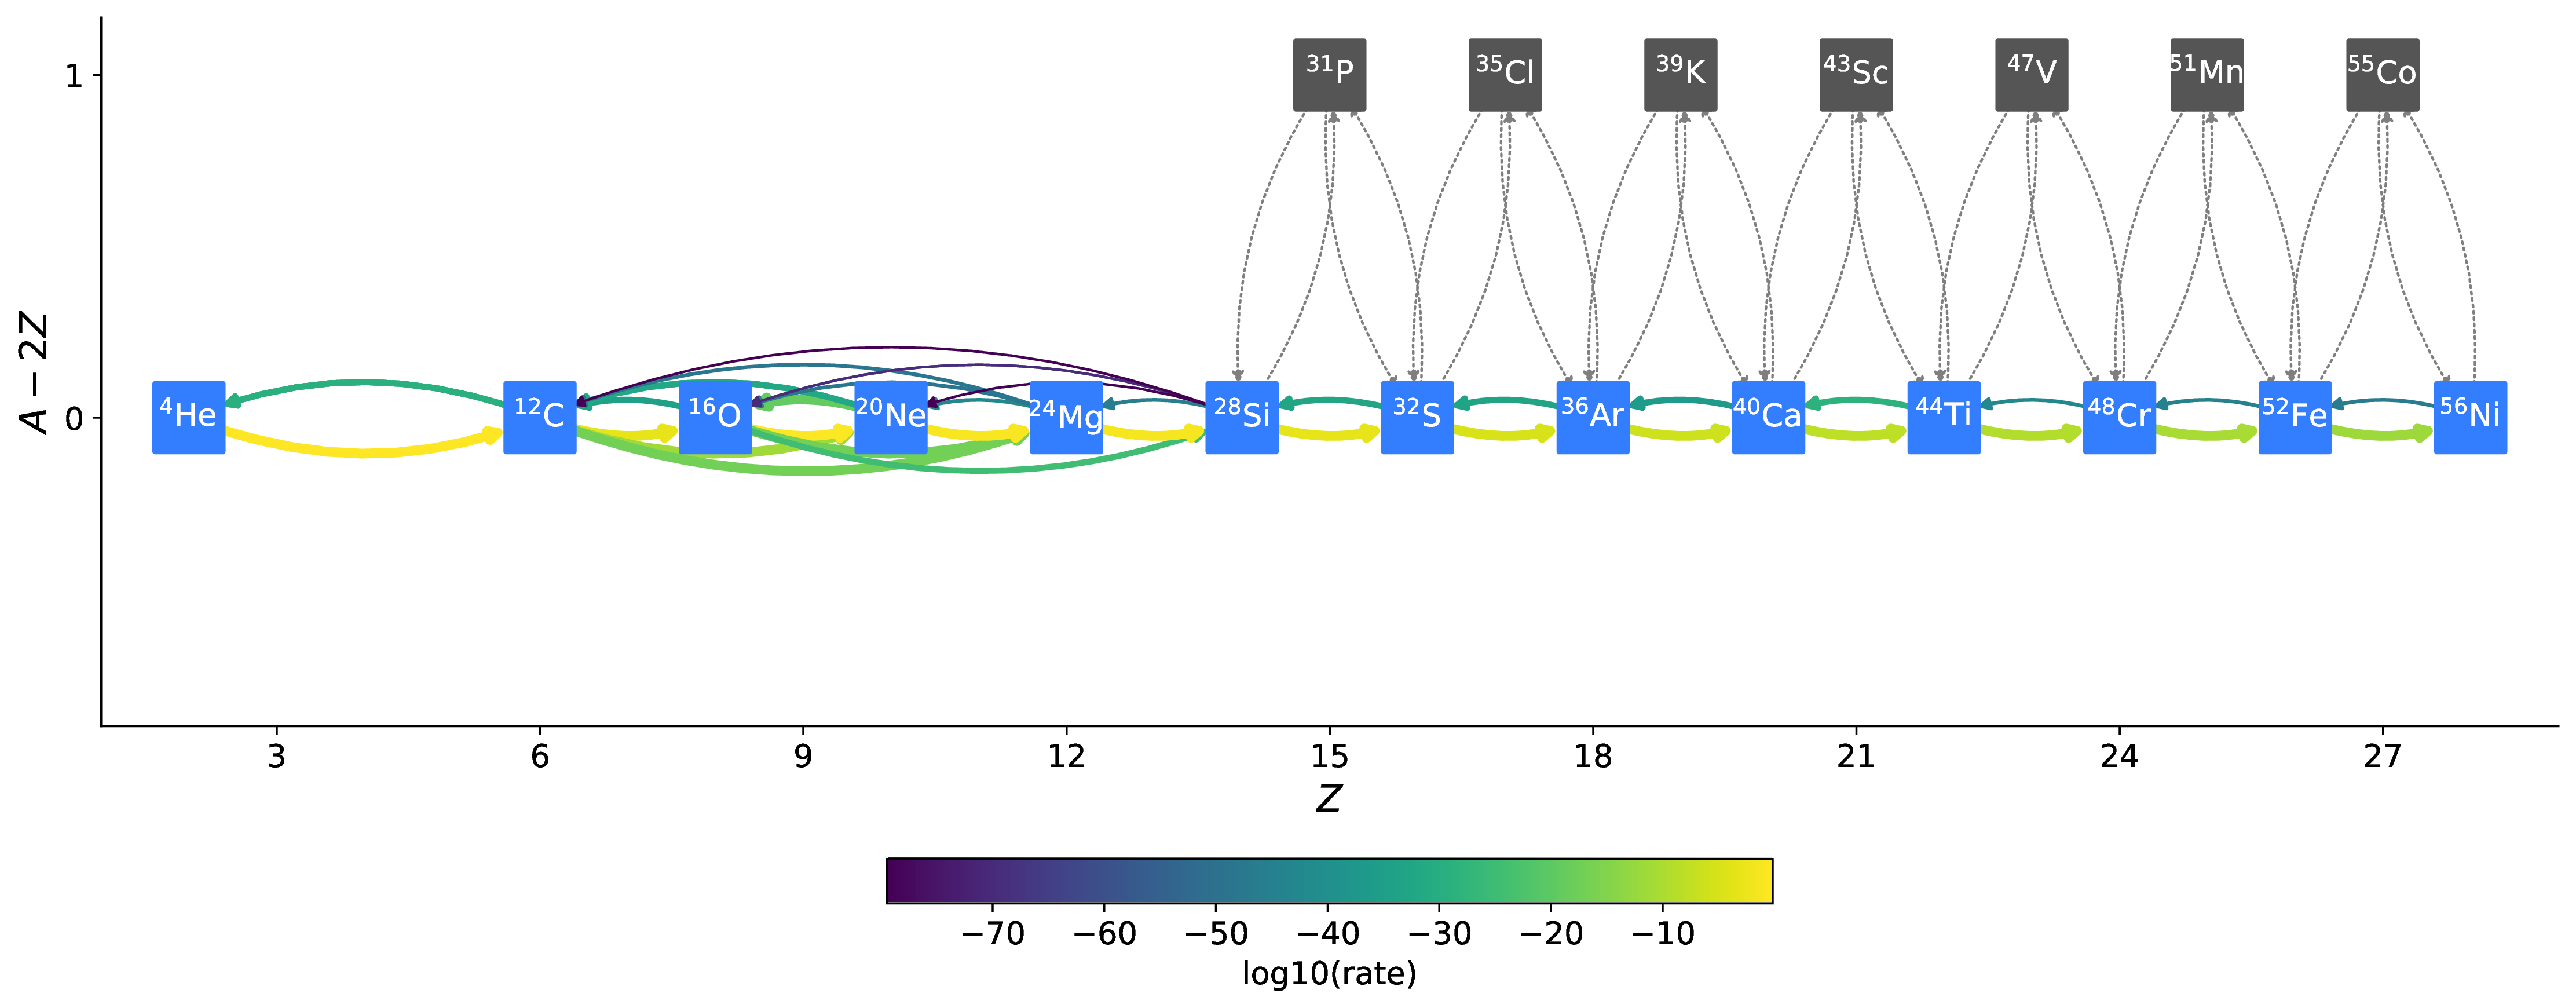
Figure 3: A visualization that shows the aprox13 network.
The most important difference between subch_simple and aprox13 is inclusion of the rate sequence, \({}^{12}\mbox{C}(\mbox{p}, \gamma) {}^{13}\mbox{N}(\alpha, \mbox{p}){}^{16}\mbox{O}\). 1D studies have shown that this rate sequence dominates over α-capture process on \({}^{12}\mbox{C}\), \({}^{12}\mbox{C} (\alpha, \gamma) {}^{16}\mbox{O}\) for \(T \gtrsim 10^9\) K, which is responsible for generating a burst of energy as temperature increases during the start of the burst.
Results
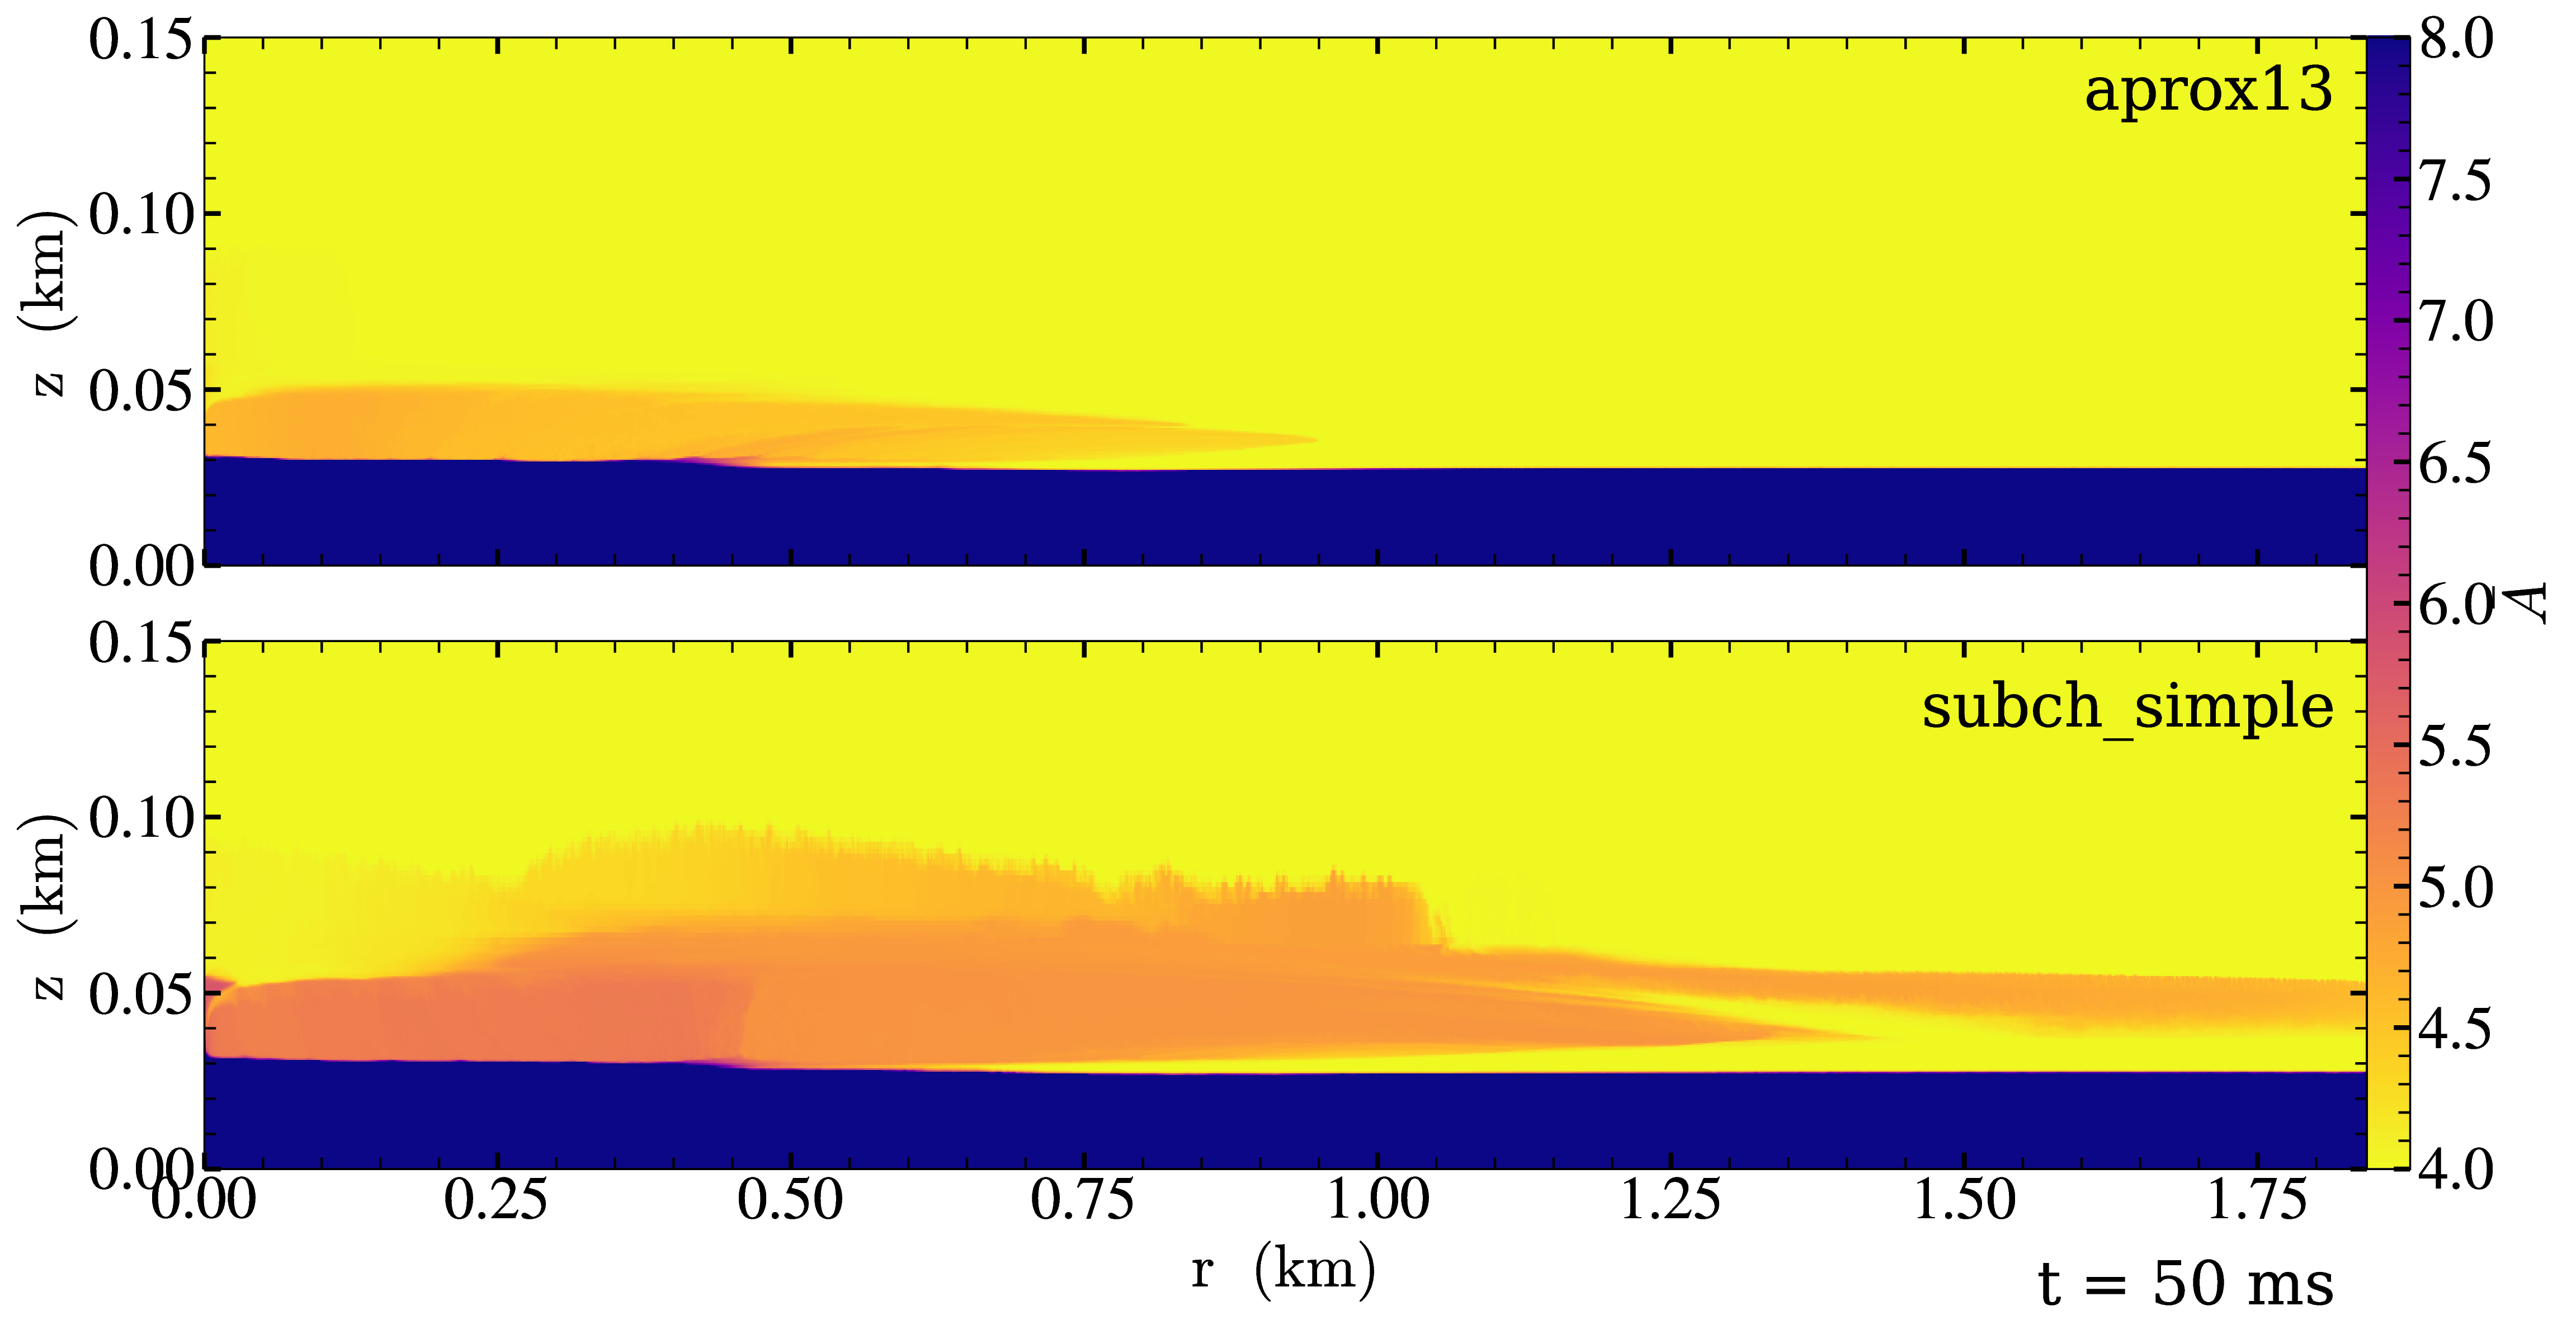
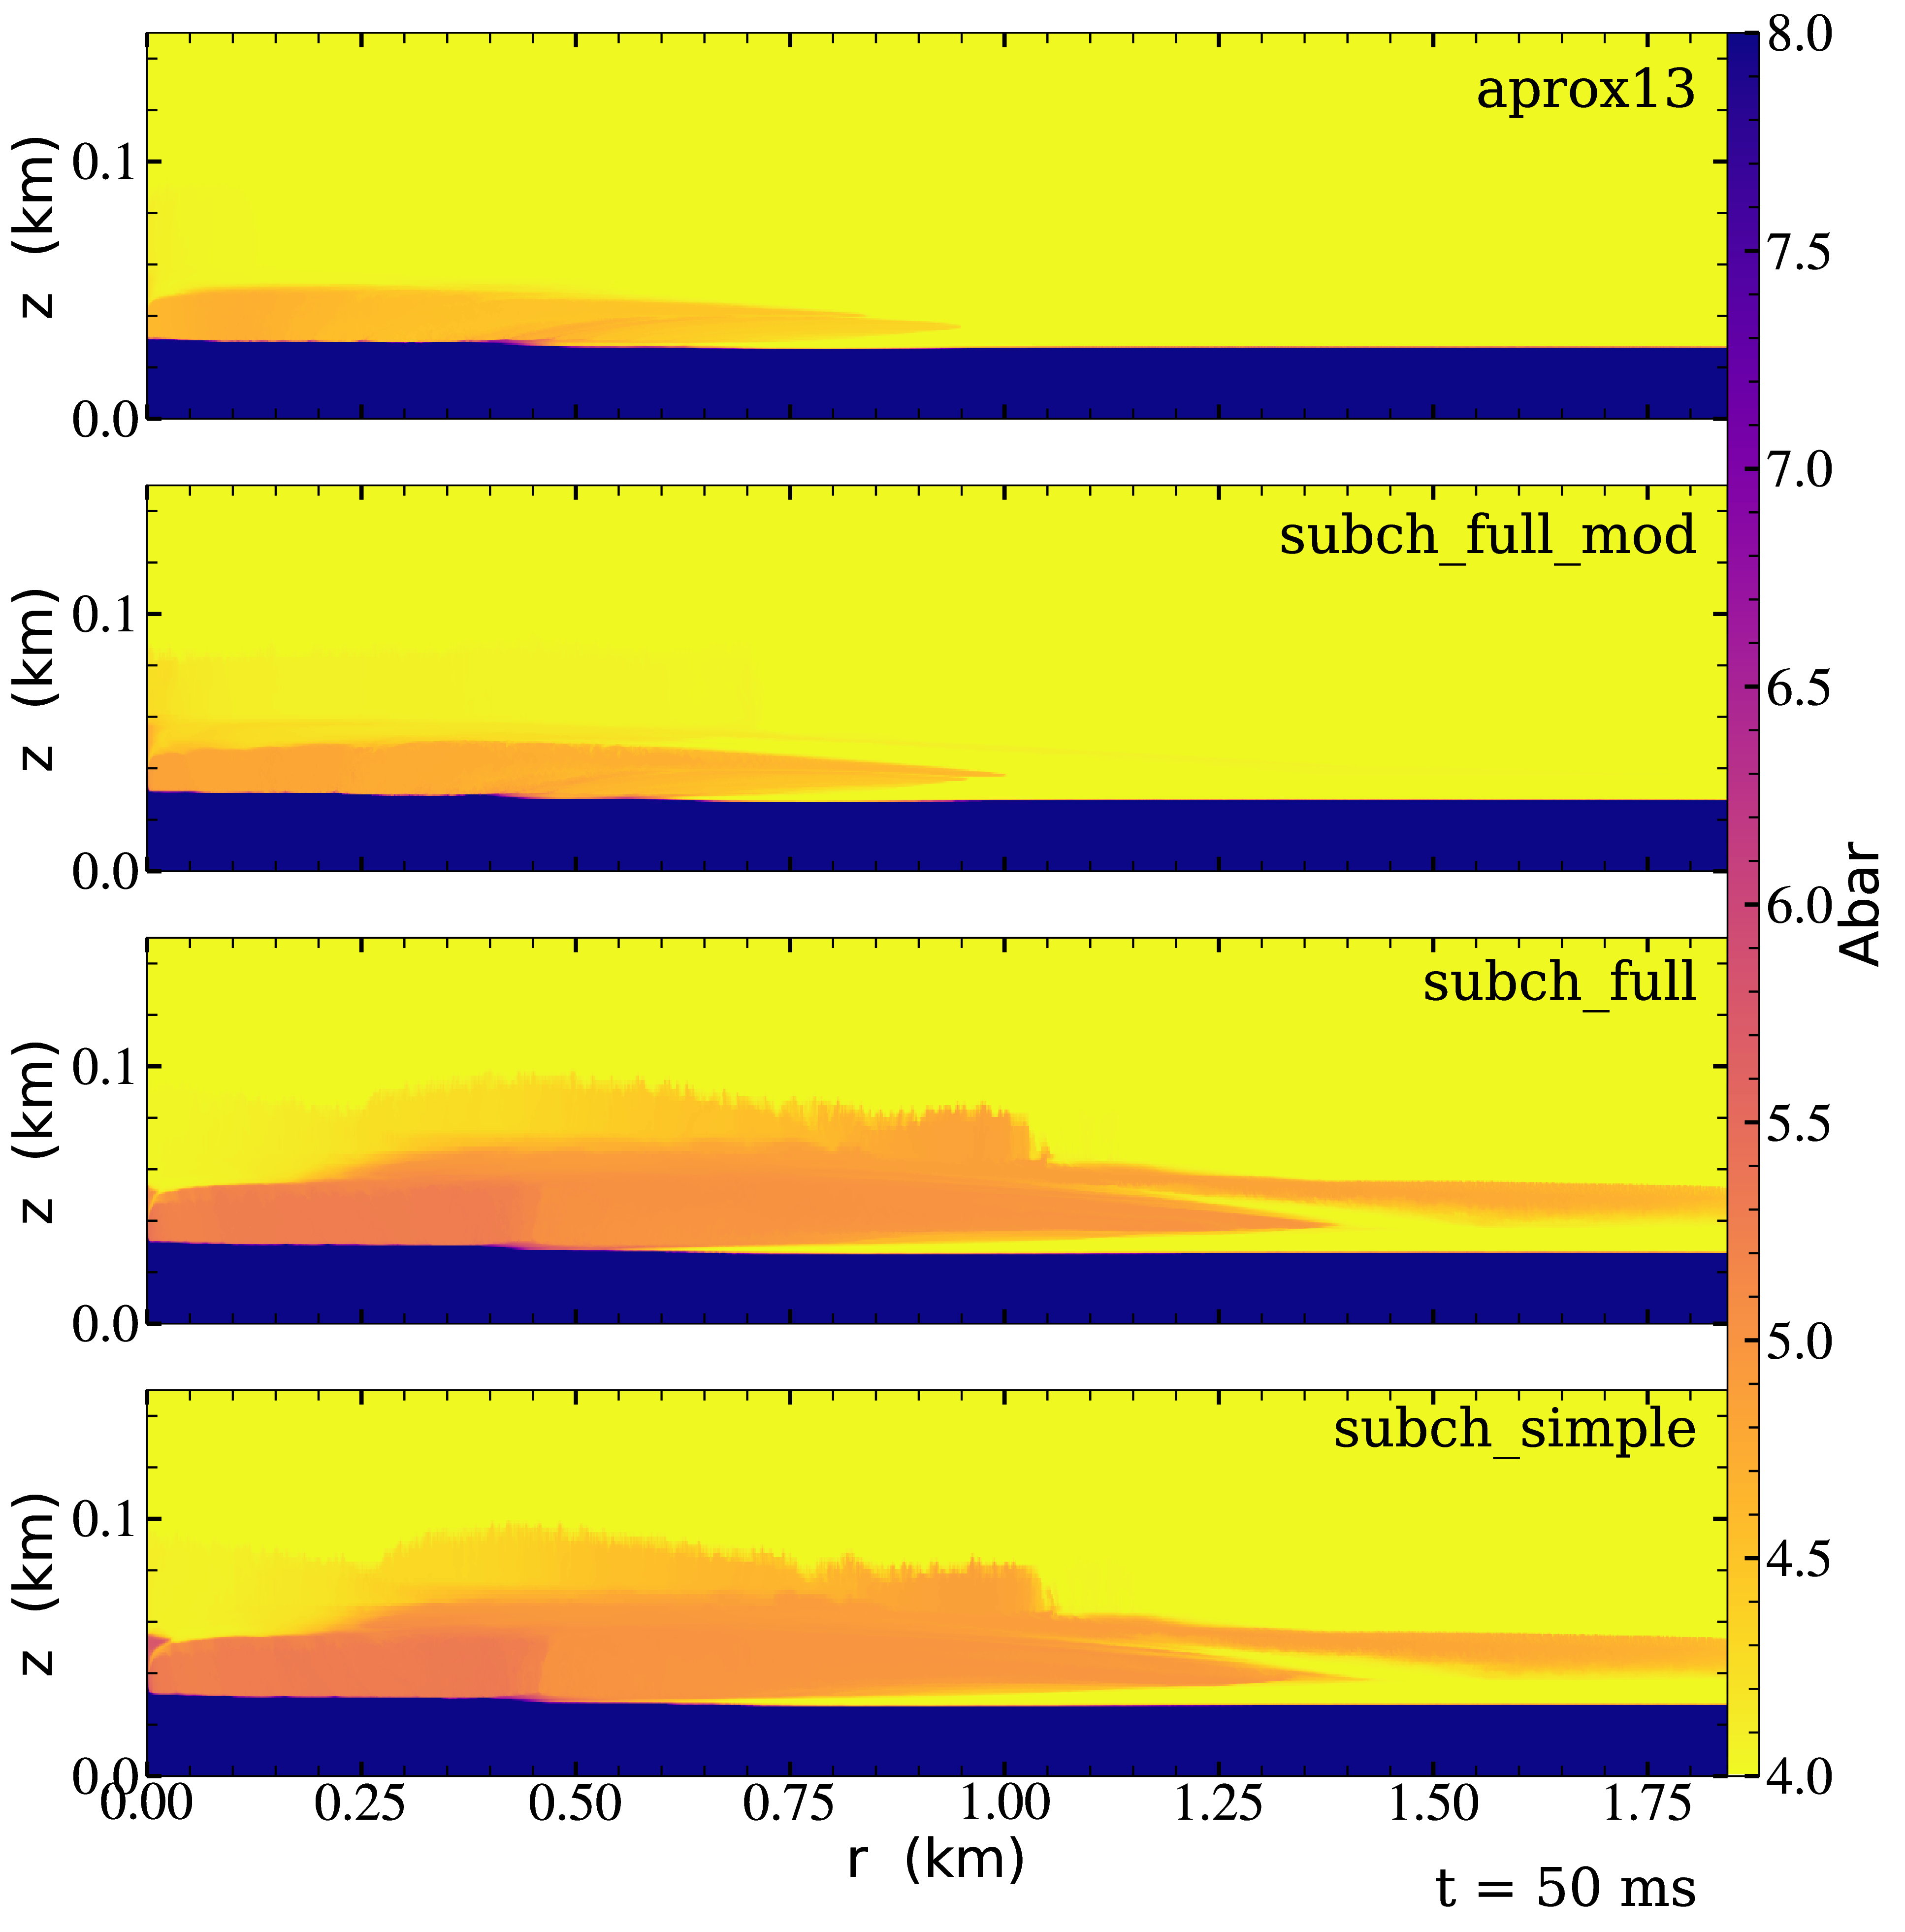
Figure 4: Slice plots showing the mean molecular weight for simulations that used different reaction network at 50 ms simulation time. A larger coverage and deeper color of the mean molecular weight for subch_simple (bottom panel) indicates a much more vigorous burning process compared to aprox13 (top panel).
Our 2D simulations show a general agreement with these 1D studies. Figure 4 shows the mean molecular weight, \(\bar{A}\), of the flame at 50 ms using the two networks. Regions with a larger \(\bar{A}\) represent the ashes from nuclear burning. Compared to aprox13, subch_simple shows a larger coverage of ash structure, both vertically and horizontally, indicating much more vigorous burning and a faster flame speed. A darker color indicate ashes are composed of heavier nuclei suggesting much more frequent late-stage burning processes.
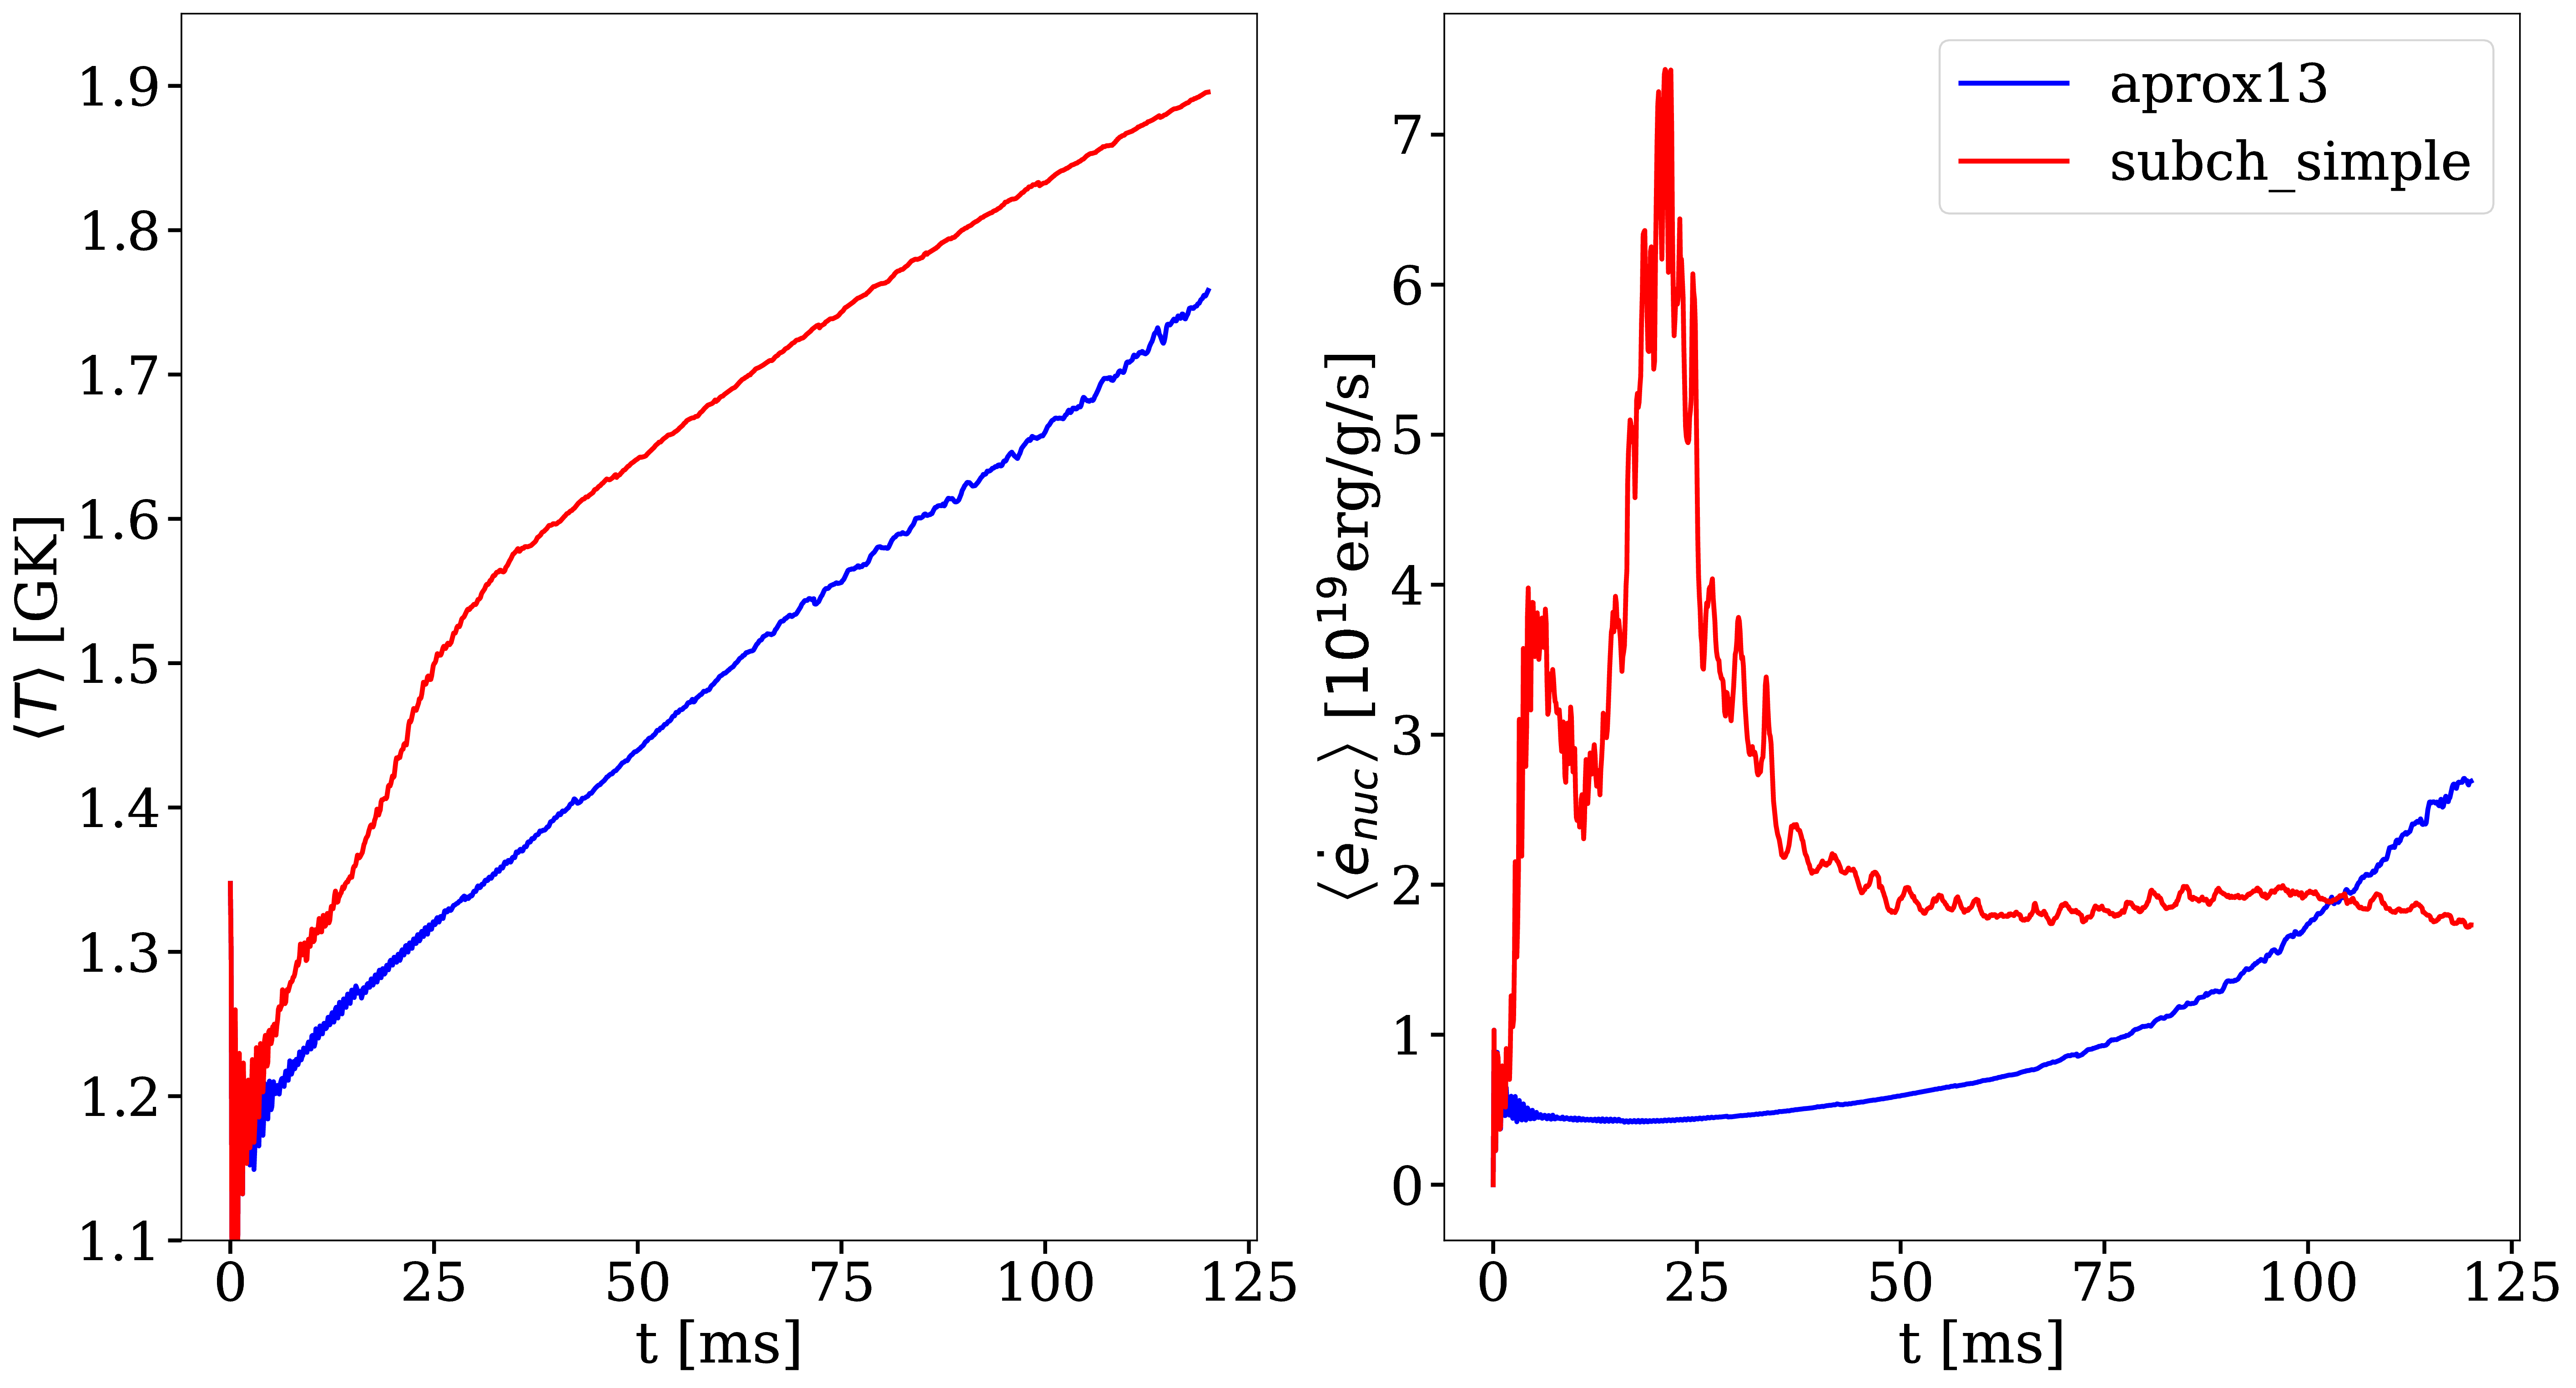
Figure 5: Time evolution of density weighted temperature and energy generation rate of the flame. subch_simple (red) shows spikes in energy generation rate (right panel) initially and at t ~ 20 ms compared to a steady increase in aprox13 (blue). This corresponds to the steeper increase in temperature (left panel) for t < 25 ms for subch_simple.
Figure 5 shows the evolution of density-weighted temperature and \(\dot{e}_{\text{nuc}}\) of the flame. Instead of a steady increase in both temperature and \(\dot{e}_{\text{nuc}}\) in aprox13, subch_simple shows burst of energies at \(\sim 20\) ms and a quick fall off afterwards.
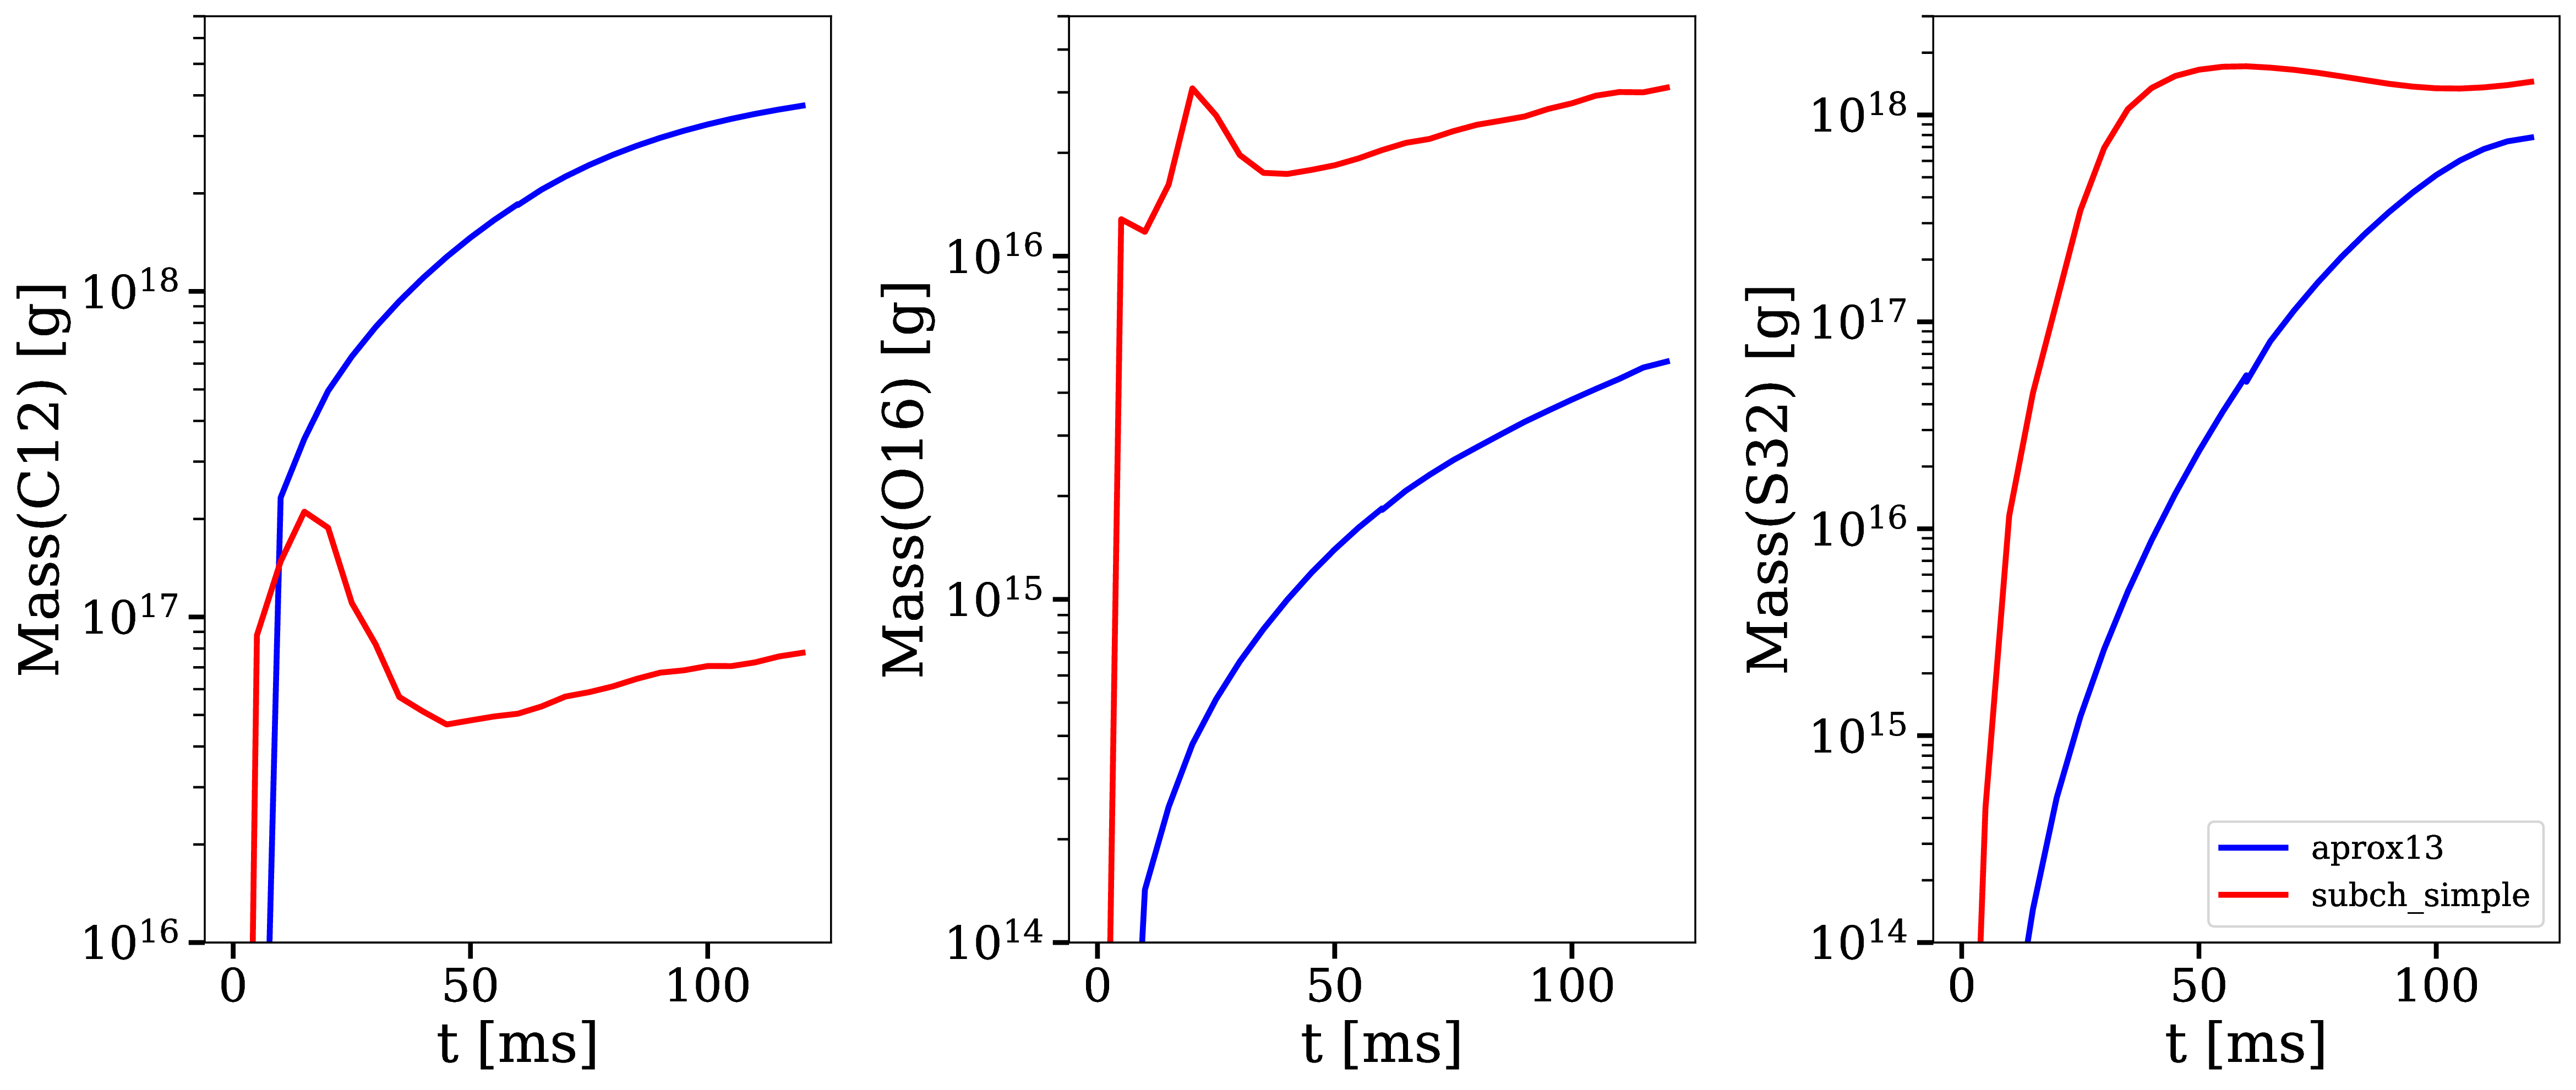
Figure 6: Time evolution of the total mass for C12, O16, and Si32. A depletion of C12 is observed at ~ 20 ms for subch_simple (red) compared to aprox13 (blue), indicating a much more efficient burning for C12 is available in subch_simple. This leads to nucleosynthesis of heavier isotopes like Si32.
To understand the behavior of this evolution trajectory, Figure 6 shows the total mass evolution of \({}^{12}\mbox{C}\), \({}^{16}\mbox{O}\), and \({}^{32}\mbox{Si}\). In contrast to the continuous buildup of \({}^{12}\mbox{C}\) in aprox13 since the network is bottle-necked by \({}^{12}\mbox{C} (\alpha, \gamma) {}^{16}\mbox{O}\), \({}^{12}\mbox{C}(\mbox{p}, \gamma) {}^{13}\mbox{N}(\alpha, \mbox{p}){}^{16}\mbox{O}\) opens up a new path way for fusing \({}^{16}\mbox{O}\) in subch_simple at \(t \sim 20\) ms with a corresponding \(T \sim 1.3 \times 10^9\) K. At this point, nuclear burning timescale for \({}^{12}\mbox{C}(\mbox{p}, \gamma) {}^{13}\mbox{N}(\alpha, \mbox{p}){}^{16}\mbox{O}\) is faster than the rate at which \({}^{12}\mbox{C}\) is produced by the triple-\(\alpha\) process. This leads to a depletion of \({}^{12}\mbox{C}\), corresponding to the burst of energy observed in Figure 5 at \(t \sim 20\) ms, as well as an early fuel exhaustion compared to aprox13.
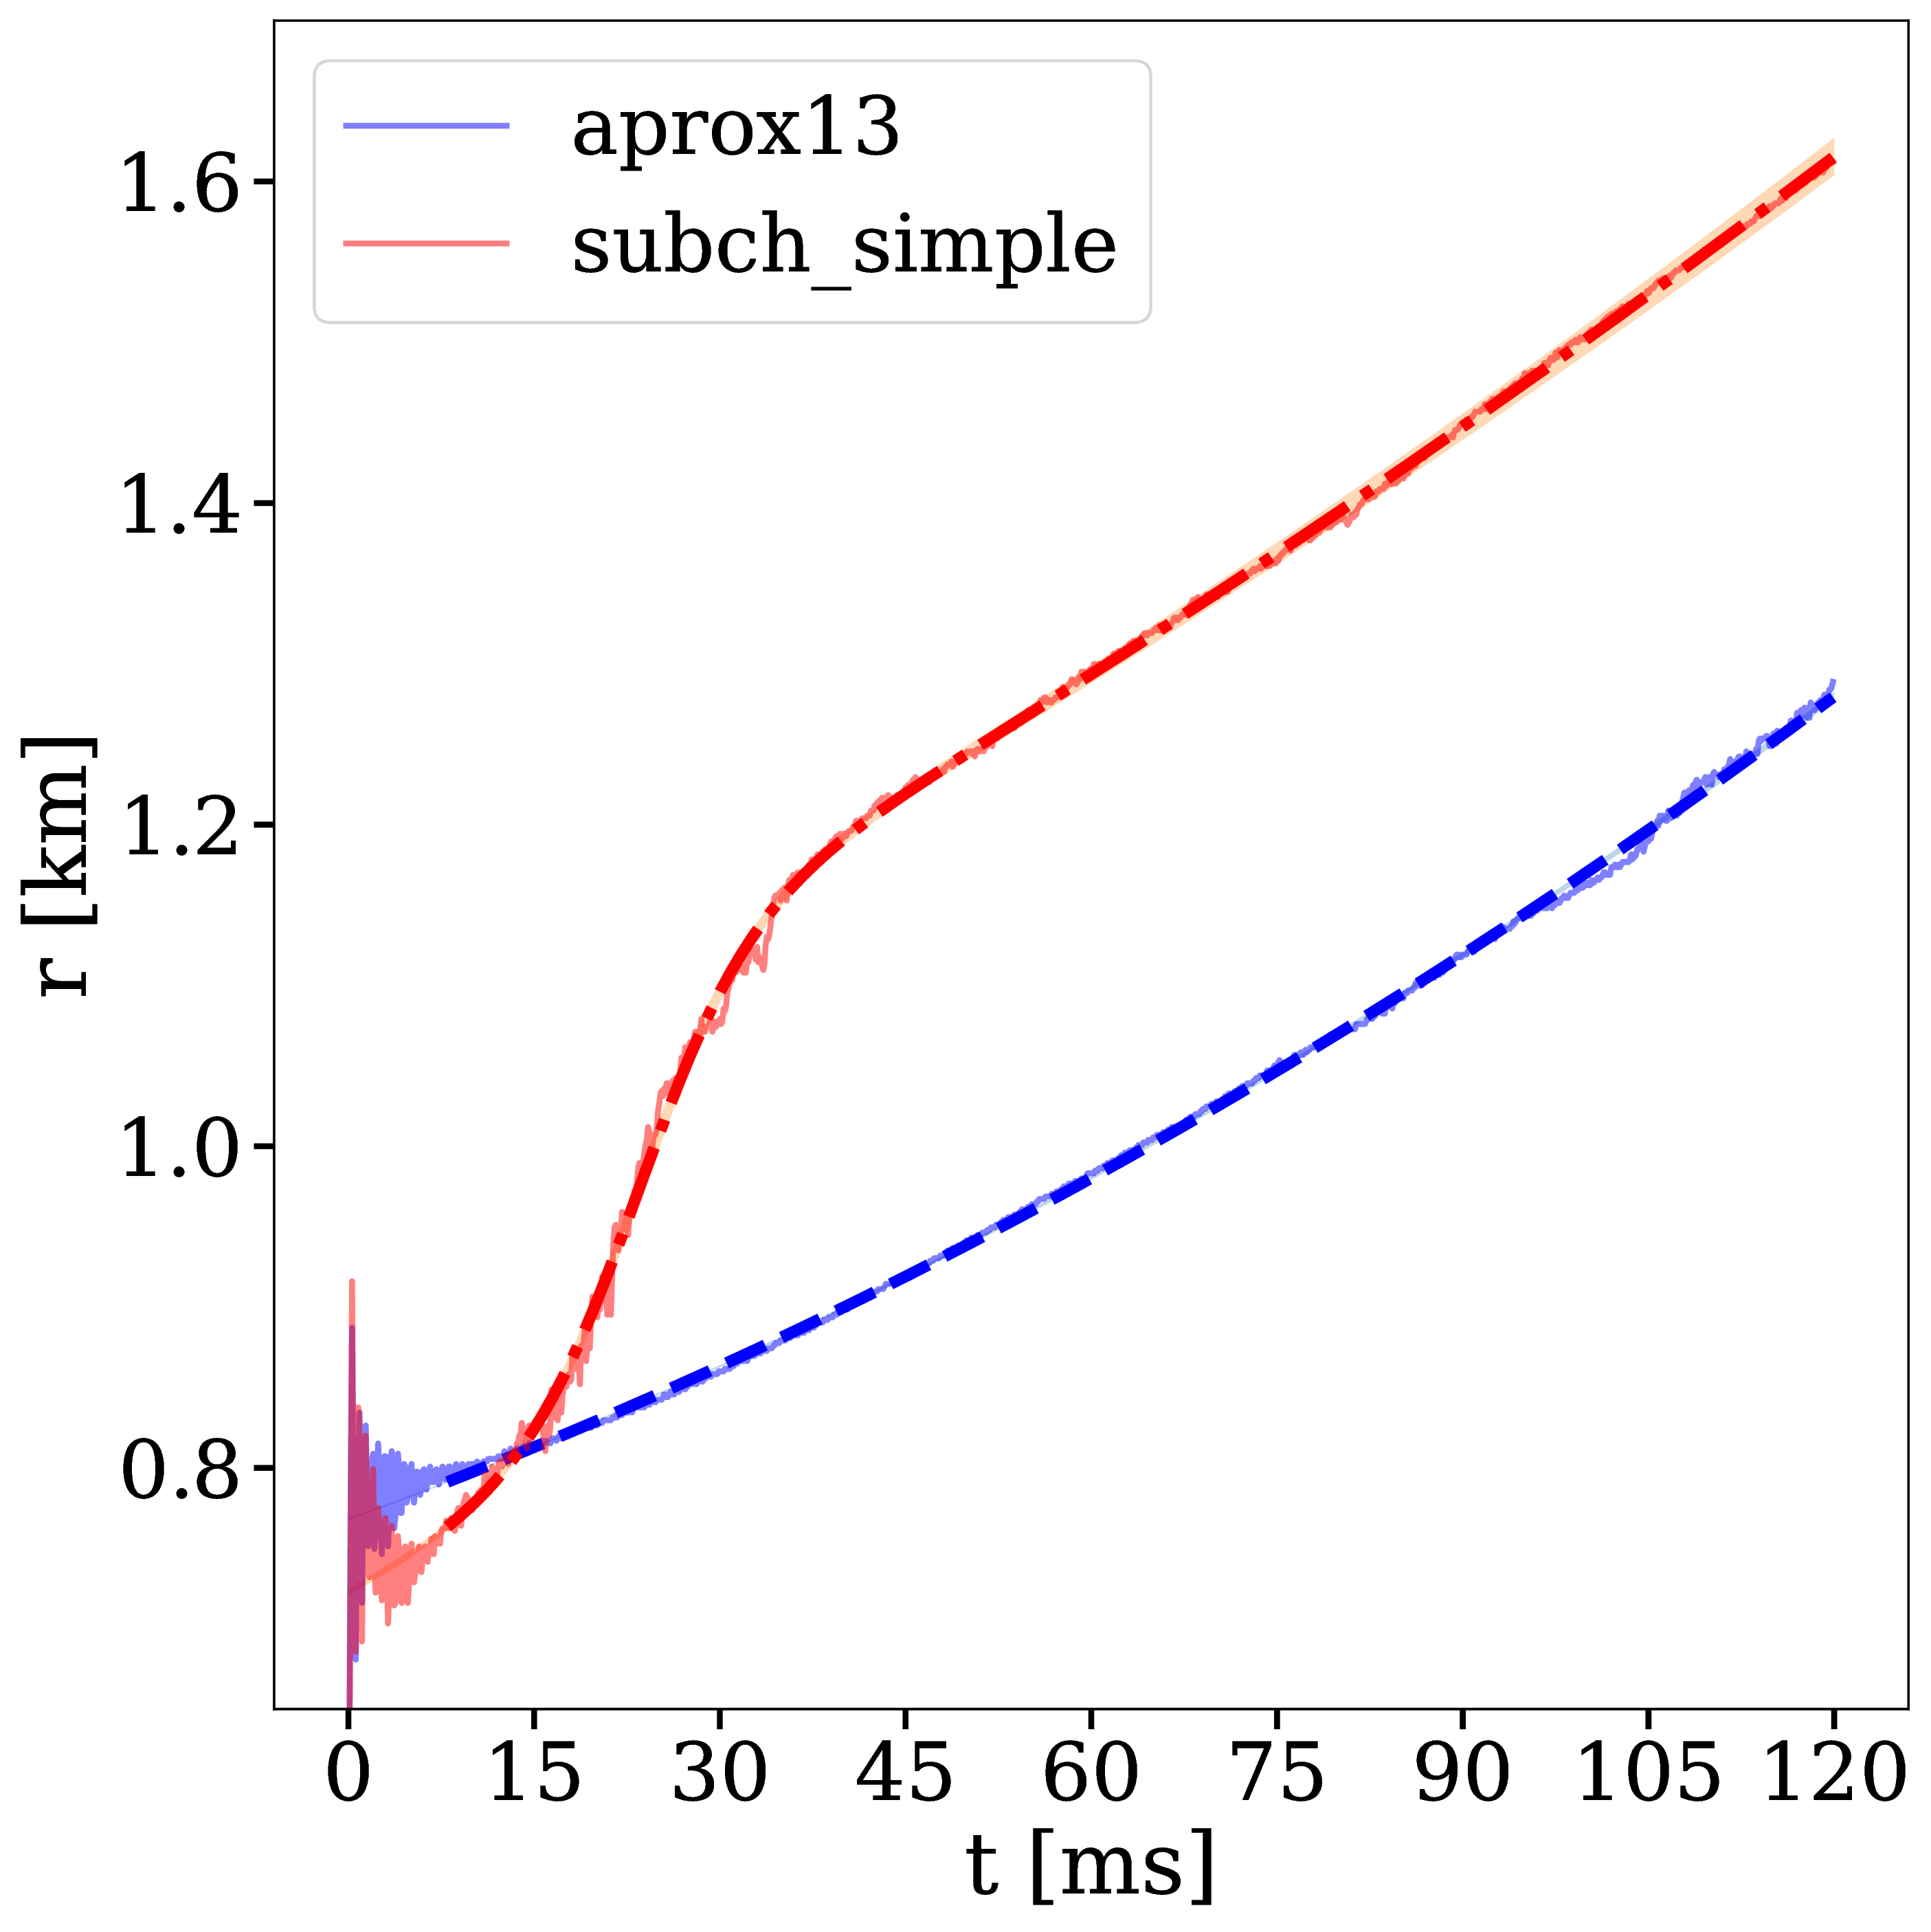
Figure 7: Time evolution of the flame front position. An initial acceleration phase is observed for subch_simple (red) in contrast to a global uniform flame propagation in aprox13 (blue).
In terms of flame speed, Figure 7 shows as initial short acceleration phase for subch_simple following by an uniform speed of \(\sim 5.0 \ \text{km} \ \text{s}^{-1}\) similar to aprox13. By extrapolating beyond the data, calculations show both models takes \(\sim 1.5\) s to reach 30 km, roughly the distance flame needs to travel to engulf the entire star. This matches with the rise time of the light curve as we discussed previously. This study gives us the confidence that subch_simple is the optimal network to use for the future full-star simulation, where we determine the time for the flame to reach maximum coverage of the star along with the influence of Coriolis force modulation without extrapolation.
Summary
All the results shown proves that \({}^{12}\mbox{C}(\mbox{p}, \gamma) {}^{13}\mbox{N}(\alpha, \mbox{p}){}^{16}\mbox{O}\) is critical for an accurate modeling of the laterally propagating He flames in X-ray bursts because it changes both nucleosynthesis and flame dynamics drastically. Lastly, we provide a movie showing flame propagation. Three different panels showing temperature, \(\bar{A}\), and \(\dot{e}_\text{nuc}\), from top to bottom.
Please see the complete study in ApJ for more detail.